"App Analysis" provides relevant operational indicators and data for effective app management, including "Overview," "Push Analysis," and "Employee Referral Details." You can have a clear and complete picture of your app's operational status through these data.
⚠️ Before you start: For Hong Kong merchants, this feature is available only on the Shopper App Pro plan.
This article will cover the following:
Please go to SHOPLINE Admin > [Shopper App Management] > [App Data Analysis] as illustrated below.
1. Overview
10 indicators will be available in the "Overview" tab, which includes "Install Activation, Page Views, Unique Visitors, App Newly Added Members, App Gross Orders, App GMV, App Total Orders, App Customers Conversion Rate, App Total Sales, and App Average Order Value."
i. Overview indicators
| Indicator | Description |
| Install Activation | When a visitor downloads and installs the app and has their first visit, it is counted as 1 time of Install Activation. The same device will only be counted once. If a customer uninstalls and reinstalls the app, the second installation will not be counted. |
| Page Views | Each time a visitor views a page while browsing the app, it is counted as 1 Page View. |
| Unique Visitors |
"New Visitor" refers to those who are visiting the app for the first time, while "Return Visitor" means those who have previously visited the app. The system will use a visitor's device ID to identify whether they have entered the app multiple times. The visitor count will be accumulated depending on the timings of a certain device ID accessing the app.
|
| New Visitor count: The number of visitors to the app for the first time. | |
| Return Visitor count: The number of visitors returning to the app. | |
| App Newly Added Members | The number of members joining from the Shopper App as a source. |
| App Gross Orders | The total number of orders completed within the app (excluding returns). |
| App GMV | The total revenue generated from orders placed within the app (excluding returns). |
| App Total Orders | The total number of orders fulfilled within the app, minus cancelled and combined orders. |
| App Total Sales | The total amount of transactions completed within the app, minus the amount from cancelled and returned orders; editing totals will also affect the total revenue. |
| App Average Order Value | App Total Sales / App Total Orders |
| App Customers Conversion Rate | The number of users who completed orders within the app / Unique Visitors |
*Note: Data on App Newly Added Members, App Gross Orders, App GMV, App Total Orders,App Total Sales, App Average Order Value, and App Customers Conversion Rate will be calculated as of 1 Feb. 2024.
ii. Functionality on this page
a. Hovering the cursor over the indicator will display a tooltip explaining what this indicator is about.
b. Click on the "calendar" icon at the top right and select the analysis range. The system defaults to "Last 30 days" and currently supports 4 options: Yesterday, Last 7 Days, Last 30 Days, and Custom. You can switch between them for comparison as per your needs. Upon completion, click Apply.
c. Click Export to download data such as Installation Activation, Page Views, Unique Visitors, New Visitor, Return Visitor, and more within the Selected Analysis Range. The downloaded file will be in .csv format.
d. Upon clicking on an indicator, the enlarged run chart will be displayed.
2. Push Analysis
You can view the performance of app push notifications in the "Push Analysis" tab, and optimize the content and Send Time of the notifications based on the data.
i. Push Analysis indicators
| Indicator | Description |
| Total push notification visitor |
The number of visitors who click the push notifications and visit the app. Note that under the aforementioned condition, the visitor count will be accumulated depending on the timings of a certain device ID accessing the app.
|
| Percentage of push notification visitor |
The proportion of "Total push notification visitor" to the total "Unique Visitors" of the app. The calculation method is as follows:
Suppose there are 100 visitors to the app within the selected analysis range, and the number of push notification visitors is 10, then the "Percentage of push notification visitor" would be 10 (Total push notification visitors) / 100 (Unique Visitors to the app) = 10%. |
ii. Push funnel data
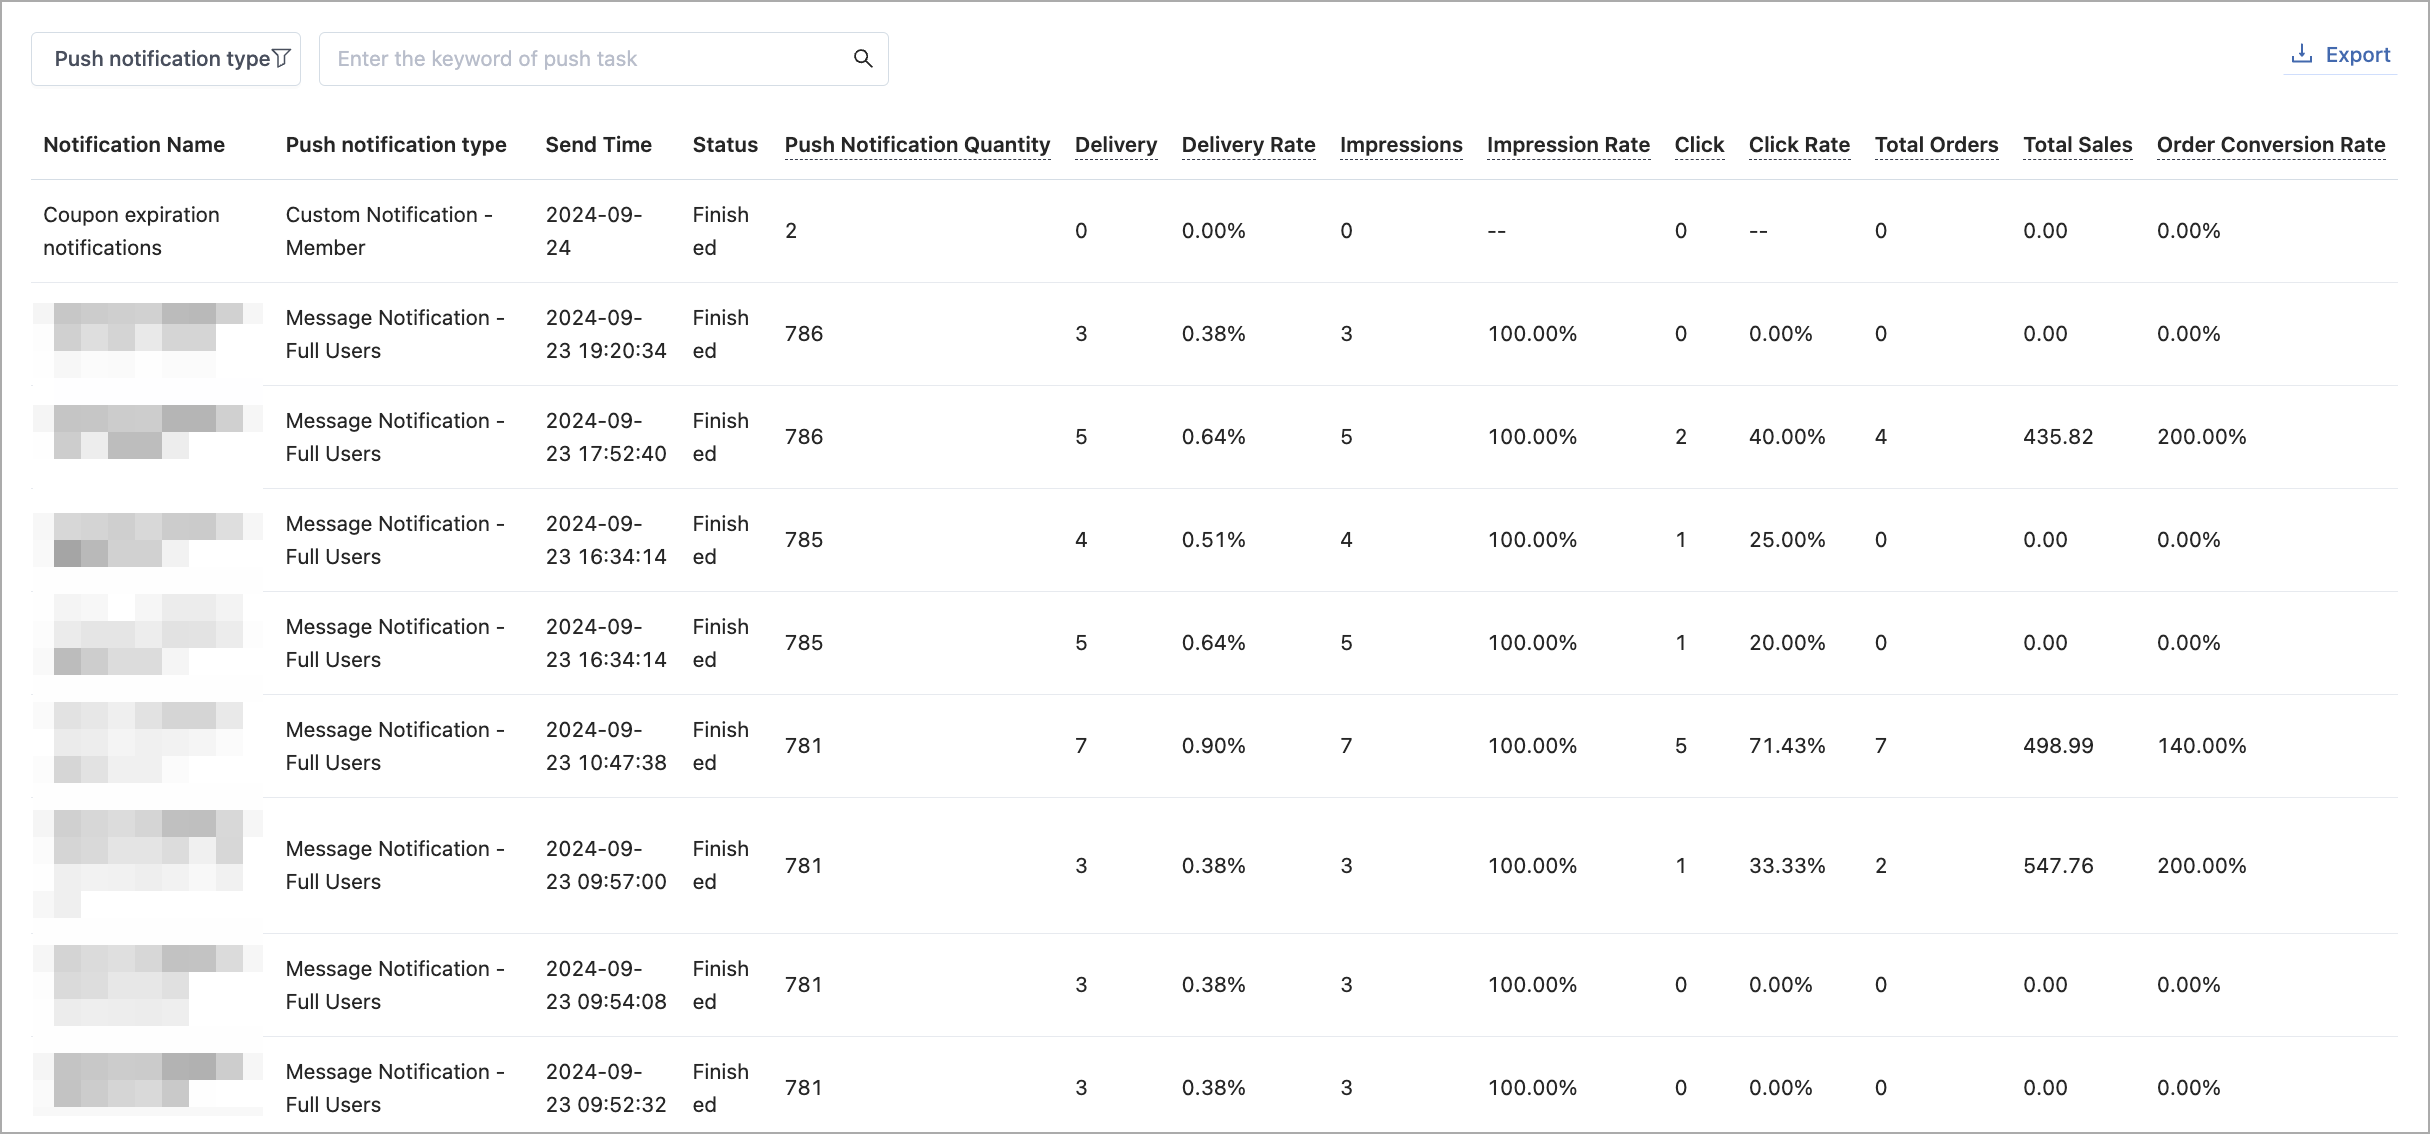
| Indicator | Description |
| Notification Name | Identifying the name of each push notification message |
| Push notification type | Identifying the type of each push notification message; there are four types altogether, including "Message Notification - Full Users," "Message Notification - Group Users," "Personal Message - Order," and "Personal Message - Member." |
| Send Time | The sending date and time of the push notification message |
| Status | The current status of the push notification message |
| Push Notification Quantity |
The number of push notification messages sent by the system. The following are three different cases:
|
| Delivery (Qty.) |
The number of push notification messages successfully sent to users' mobile devices. The calculation method is as follows:
*Note: If the user has uninstalled the app, disabled notification services, or the mobile device is unable to connect to the internet, it will result in delivery failure. |
| Delivery Rate |
The proportion of successfully delivered messages out of the total number of messages sent. The calculation method is as follows:
|
| Impressions (Qty.) |
The number of push notification messages successfully delivered and displayed in the app. The calculation method is as follows:
|
| Impression Rate |
The proportion of successfully displayed quantity out of the delivered quantity. The calculation method is as follows:
|
| Click | The number of users who clicked on the push notification messages |
| Click Rate |
The proportion of the number of users who clicked on the push notification messages out of the display quantity. The calculation method is as follows:
|
| Total Orders | The total number of orders placed within 24 hours after users click on the push notification and enter the app (excluding returns). |
| Total Sales | The total revenue generated from orders placed within 24 hours after users click on the push notification and enter the app (excluding returns). |
| Conversion Rate |
The percentage of users who placed an order after clicking on the push notification. The calculation method is as follows:
|
*Remark 1: Before 12 July 2024, "Delivery", "Impressions", and "Clicks" are only tracked for the day of push notification sending. From 12 July 2024, the data will cover the 7 days (168 hours) following the push, e.g., a push sent on 12 July 2024, will be counted until 18 July 2024.
*Remark 2: "Total Orders", "Total Sales", and "Conversion Rate" are only tracked from 25 Sep 2024. Related data is only displayed on the page and is not included in exported reports.
iii. Functionality on this page (Push funnel data)
a. Filter: Click on the drop-down menu to filter the push notification types (multiple selections allowed). Upon completion, the data list below will be updated accordingly.
b. Search: Enter keywords to search for specific push notification messages.
3. Employee Referral Details
You can view the performance of store referrals in the "Employee Referral Details" tab.
i. Employee Referral Details Indicators
| Indicator | Description |
| Employee Name | Displaying all employees' names from the Admin > [Retail Store] > [Employee] |
| Number of App Referrals | The number of customers who have downloaded and installed the app through employee referrals and have successfully linked to their referrers. Each customer will be counted only once. |
ii. Another Route to Employee Referral Details
You can also go to the Admin > [Shopper App Management] > [App Settings] > [Store Referral Settings] > [Staff Referral Analytics] to view the Employee Referral Details.
Read more
Comments